| |
| Racing track analysis in graph view |
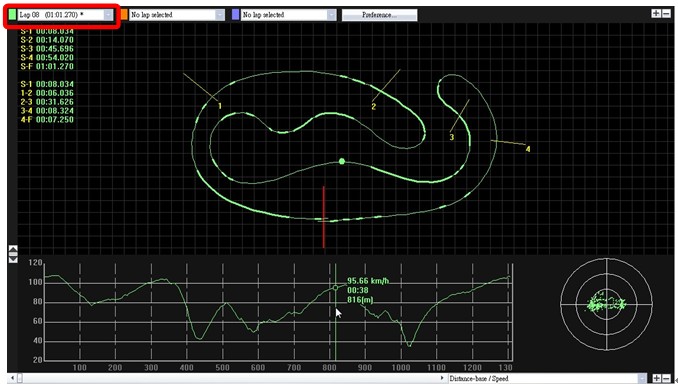
| 1. Record and analyze the best single lap |

|
Just drive or ride with Qstarz GPS Lap Timer products to record racing data, then QRacing can simply analyze the best single lap and related analysis in graph view easily. |
| |
 |
| |
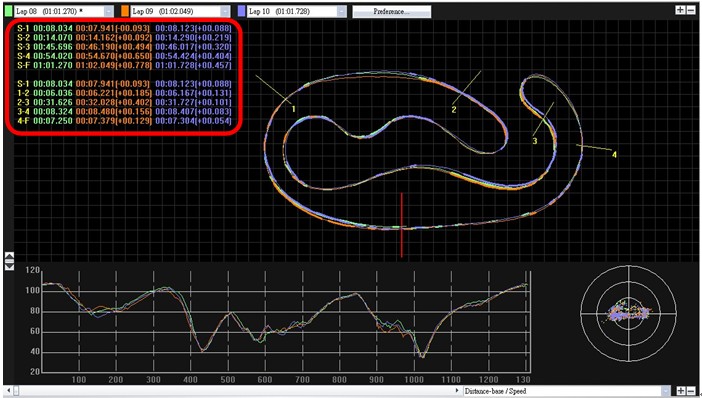
| 2. Track map analysis and compare up to 3 Lap data |
|
You can select up to 3 Laps to show and compare the data in different color. And also compare the laps by line graph with distance-base or time-base. |
| |
 |
| |
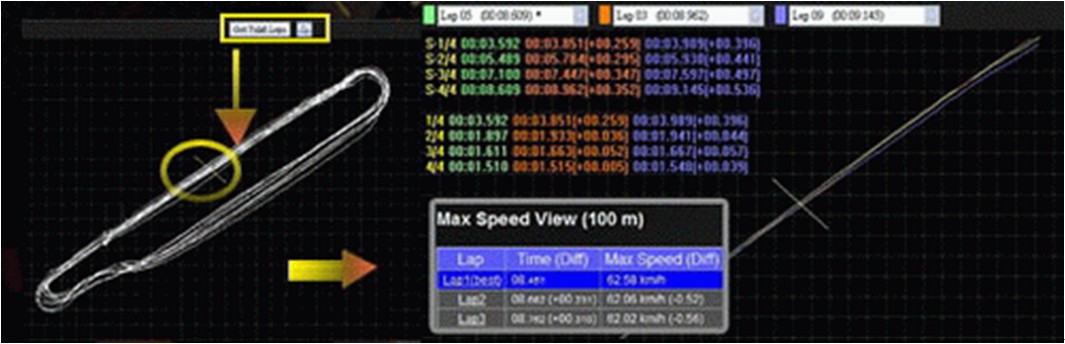
| 3. View and analyze Drag Racing easily |
|
Just simply place a beacon to “Get Valid Lap” and auto calculate the Drag Racing result. You can select to divide the lap into four or ten segments and the duration of each segment will show in detail. |
| |
 |
| |
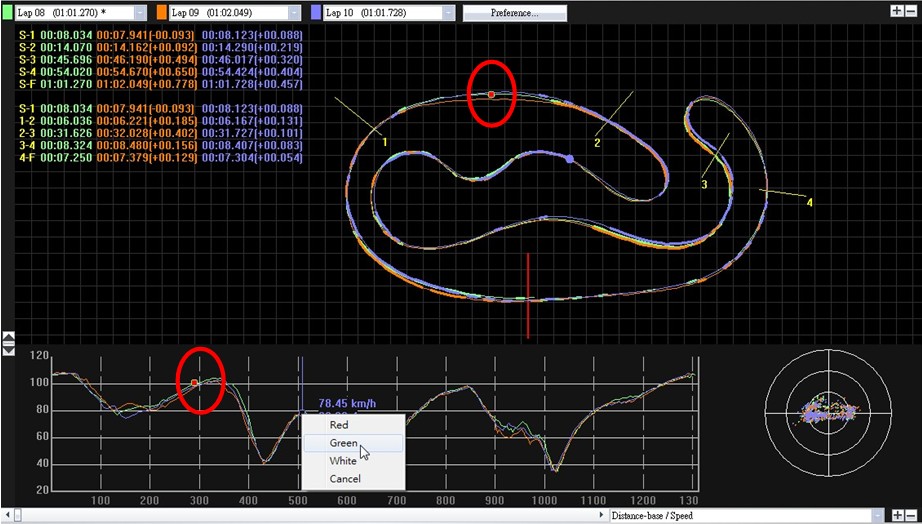
| 4. Color tagging on track map or graph line |
|
Give tags on the track or on the graph line with three different colors to mark the position for defining accelerate points or deceleration points. |
| |
 |
| |
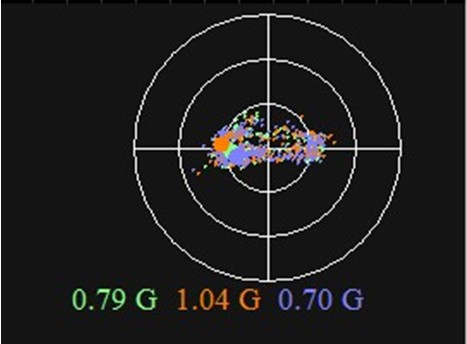
| 5. Show G-Force line and G-Value distribution |
|
QRacing supports to show G-Force status while track replaying, and show G-value distribution of selected track. |
| |
 |
| |
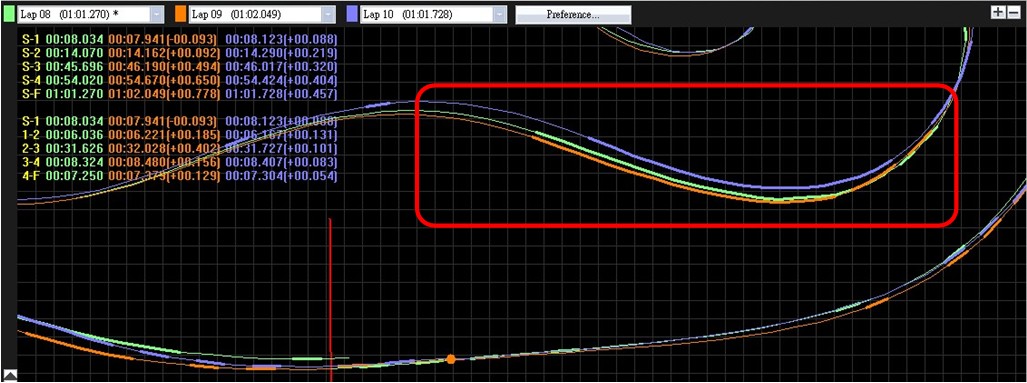
| 6. Show deceleration line |
| |
QRacing supports to show the deceleration line on the track. You can compare the tracks and get acceleration and deceleration information. (The thick lines present the deceleration zone, and the thinner lines present the acceleration zone.) |
 |
| |
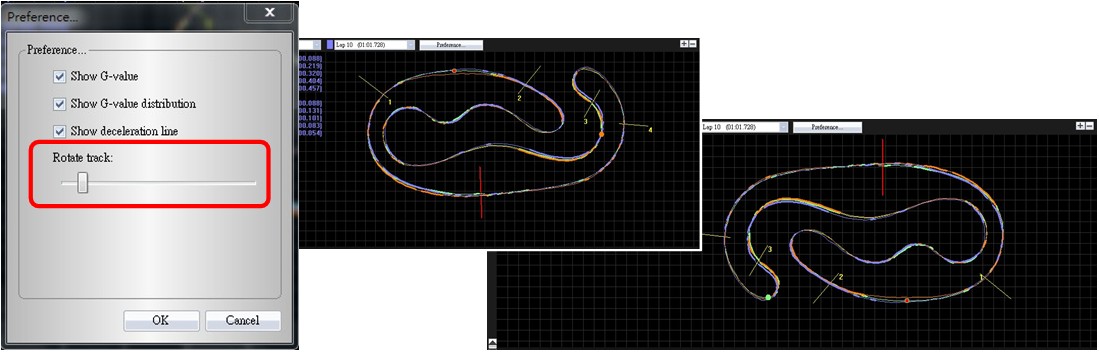
| 7. Rotate track |
|
QRacing supports to rotate heading of the track with 360 degrees. |
| |
 |
| |
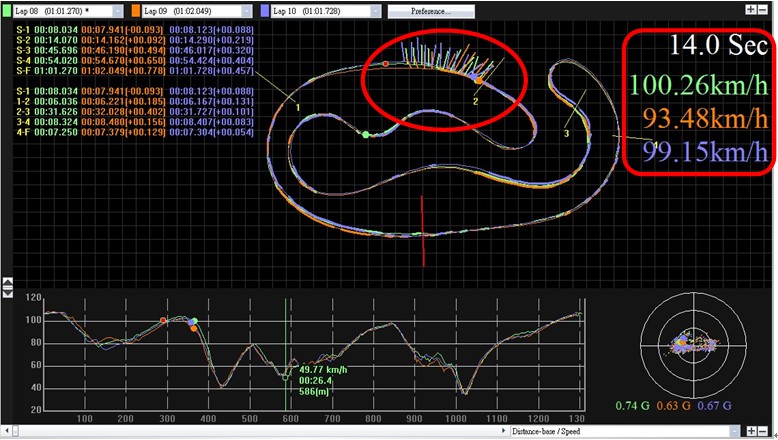
| 8. Track replay view |
|
It can replay selected 3 laps and display the racing information simultaneously and also G-value line on the track for reference. And track replay can be started either from start line or selected split number for precise analysis. |
 |