|
1. Record and smartly organize ECO-analysis report.
a. Instantly view individual driving performance in star level and trend chart (Single staff)
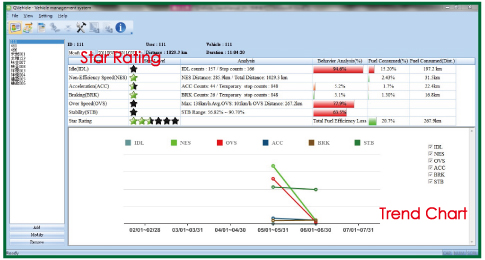
QVehicle gives an individual summary of your driving behavior (Idle, Non-efficiency speed, Acceleration, Braking, Over Speed and Stability) by Star Rating and Fuel consumption in percentage & mileage. Best Star rating is 6 stars, and below 4 stars means poor fuel efficiency. You also can see the trend of individual driving behavior with six periods from trend chart.
b. View Staff rating to find out best and worst employee’s driving behavior (All staff)
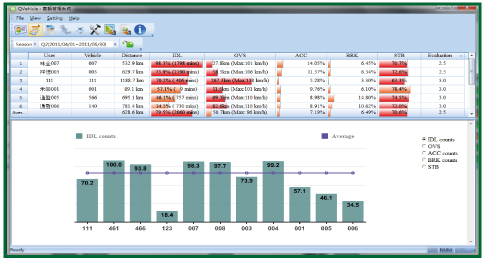
Staff Rating shows the list of all users’ rating with Driving behavior percentage by weekly, monthly or seasonal basis.
The bar chart below illustrates all users’ rating by selective item (Idle, Over Speed, Acceleration, Braking and Stability).
And you can switch to view Staff Rating in Fuel consumption percentage as well.
c. Flexible setting criteria to view analysis report conveniently
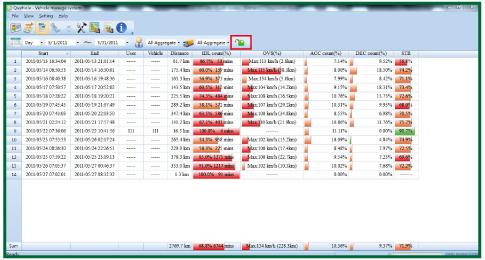
Vehicle report View shows the trip data and summary by filter function with Time interval (day, week, month or season), User or Vehicle. Given the fleet manager flexible options to review the vehicle report. And you can view report analysis either in driving behavior percentage or Fuel consumption percentage.
d. Precisely find out where and when to happen non-efficient driving behavior in Detail view
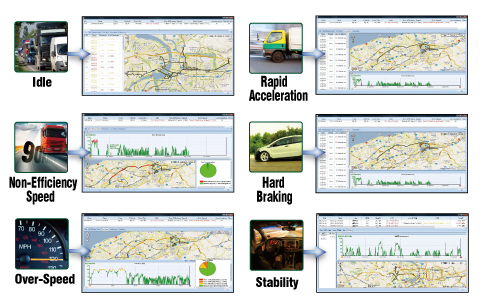
Six kinds of driving behavior analysis (Idle, Non-Efficiency Speed, Over Speed, Acceleration, Braking, and Stability) will guide you to precisely improve your driving habits. Each detail view will show where and when to cause non-efficient driving in Google Map as well as chart table.
|